
Charts for Optometrists
Acuitykit Charts is a software product that provides a variety of easy to control digital eye charts. Your patient sees the chart on a display of your choice, and you control what they see using a phone or an attached keyboard.
Benefits
- A single solution that provides a full range of charts to assess different conditions.
- Flexible set-up that supports your working environment and needs.
- It can be used with existing hardware to reduce costs.
- Ease of use through different control methods, to suit how you work.
- Efficient workflow.
- You can display marketing messages of your choice when not in use.
Chart features
There is a full suite of charts including:
- letter displays taking into account individual letter legibility. Every row of letters has a bounded variation to take account of different letter legibility, which eliminates rows that are made up of too many easy or too many hard letters. This is unique to the Acuitykit system.
- testing distance can be configure from 1 to 10m.
- adjustable associated phoria.
- distance Amsler grid.
- Worth 4 dot test.
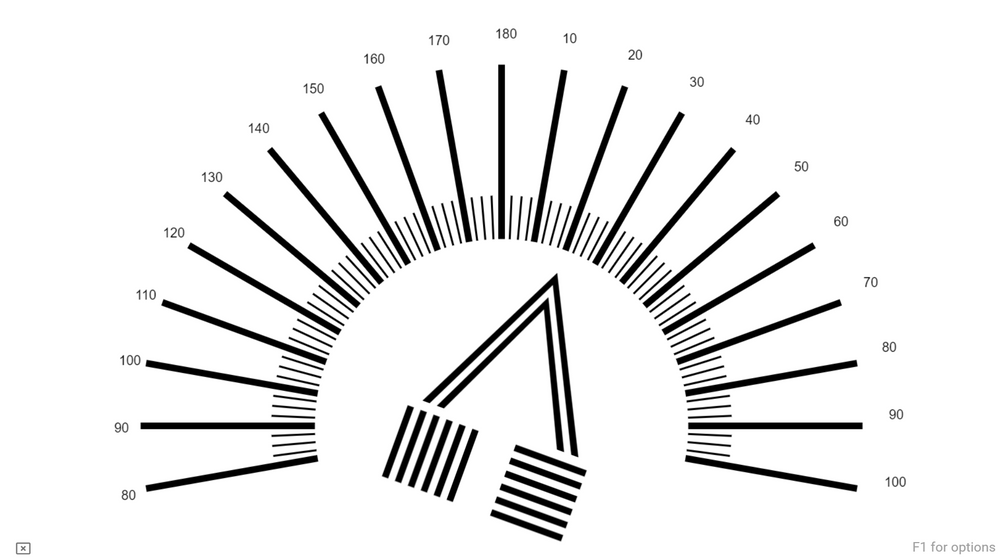
- fan and block including a Raubitschek dial which enables highly accurate axis assessment.
- near vision charts including N notation assessment, adjustable associated phoria, duochrome and Amsler grid.
- enhanced letter, number and symbol matching tests for children
- child distraction videos to focus younger children to look forward.
- full help screens for all charts and options.
Examples
Basic letter configuration

Duochrome

Adjustable associated phoria display

Fan chart
Set up how you work
Acuitykit Charts is designed to fit your way of working. There are 3 ways to use it:
- Run it on your desktop PC, with a second monitor set up where the patient will see it at a measured distance.
- Run it on a dedicated PC. Small NUC computers running Windows 10 are ideal for this.
- Run it on a laptop for domiciliary work.
In addition, you can set up the charts to be mirrored for smaller working areas.
Controlling the charts
Once the charts are running on your PC, there are different ways to control it:
- Use the keyboard on your PC
- By scanning a QR code in the app, you can open a browser on a mobile device that gives you a control panel, for maximum flexibility.
- Attach a wireless numeric keypad to your PC, and you can use that for all primary controls. It also includes a help key to show what the keypad buttons do.
Using your phone or wireless keypad gives you the ability to move around and still control the charts, very helpful in a clinical setting.
Promotional slides
You can add your own promotional images that are displayed when you are not actively using the charts with a patient.
Software updates
The product is periodically updated as new features are added. All licenses are eligible for perpetual updates. New versions are available for you to apply immediately and free of charge.